Step-by-step workflow guide for investigators
Posting Pattern Analysis
Starting from a collection already sitting in an Evidence project, this guide walks you through reading that material for behavior rather than content — when an account posts, who engages with it repeatedly, and whether the engagement it attracts was earned or manufactured. By the end you will have an assessment of how the account operates, stated precisely enough to defend.
Who is this for?
Intelligence analysts, law enforcement agents, and investigators. The trigger is a suspicion you cannot settle by reading the content — that an account is automated, run by a team, or being amplified by a group acting together rather than by an audience.
What is on this page?
A step-by-step guide to reading a completed Evidence collection for behavioural patterns. It covers confirming your collection can answer the question, reading the hourly and day-of-week distributions, mapping interaction structure in the graph, and identifying whether engagement was self-generated.
New to Evidence?
No problem. Every platform feature mentioned in this guide links to the relevant product documentation so you can read up as you go.
Platforms and data sources
Evidence has no third-party data providers. Its data source is the set of social media accounts you supply — commonly called sock puppets — which sign in and collect on your behalf.
Evidence supports collection from Instagram, Facebook, X, LinkedIn, TikTok, YouTube, Telegram, VKontakte, Odnoklassniki.
Before you start
This guide assumes that you have already installed Maltego Evidence and collected the data.
If you are looking for guidance on how to install Evidence, set up crawling profiles, and start your collection task, check out the videos on the Evidence product page first.
Your collection should have:
— Engagement data: posts, comments, reactions, reactors.
— A time window long enough for a rhythm to show: at least a week.
If you are looking for guidance on how to install Evidence, set up crawling profiles, and start your collection task, check out the videos on the Evidence product page first.
Your collection should have:
— Engagement data: posts, comments, reactions, reactors.
— A time window long enough for a rhythm to show: at least a week.
What this analysis can and cannot establish
Findings here describe observed behavior within a defined collection window. Make sure you set your collection task to a time window large enough for meaningful data interpretation.
Questions this workflow answers:
— When is this account active, and is that distribution consistent with a single person?
— Which accounts engage repeatedly, rather than once?
— Was the engagement on this content produced by other people, or by the author?
Note: Evidence surfaces distributions, clusters, and links. None of that is a finding until you have decided what it means and can defend the reasoning. Correlation between accounts is where the analysis starts, not where it ends.
Video Overview
Watch a real-world workflow demonstration. Then follow the step-by-step guide below to build your own, or skip the video and jump straight to the steps. Please note that you might not be able to replicate the findings, if the owner of the profile has changed the content or the privacy settings.
To enlarge, double-click on the video.
Step-by-Step Guide
Step 1: Read the Hourly and Day-of-Week Pattern
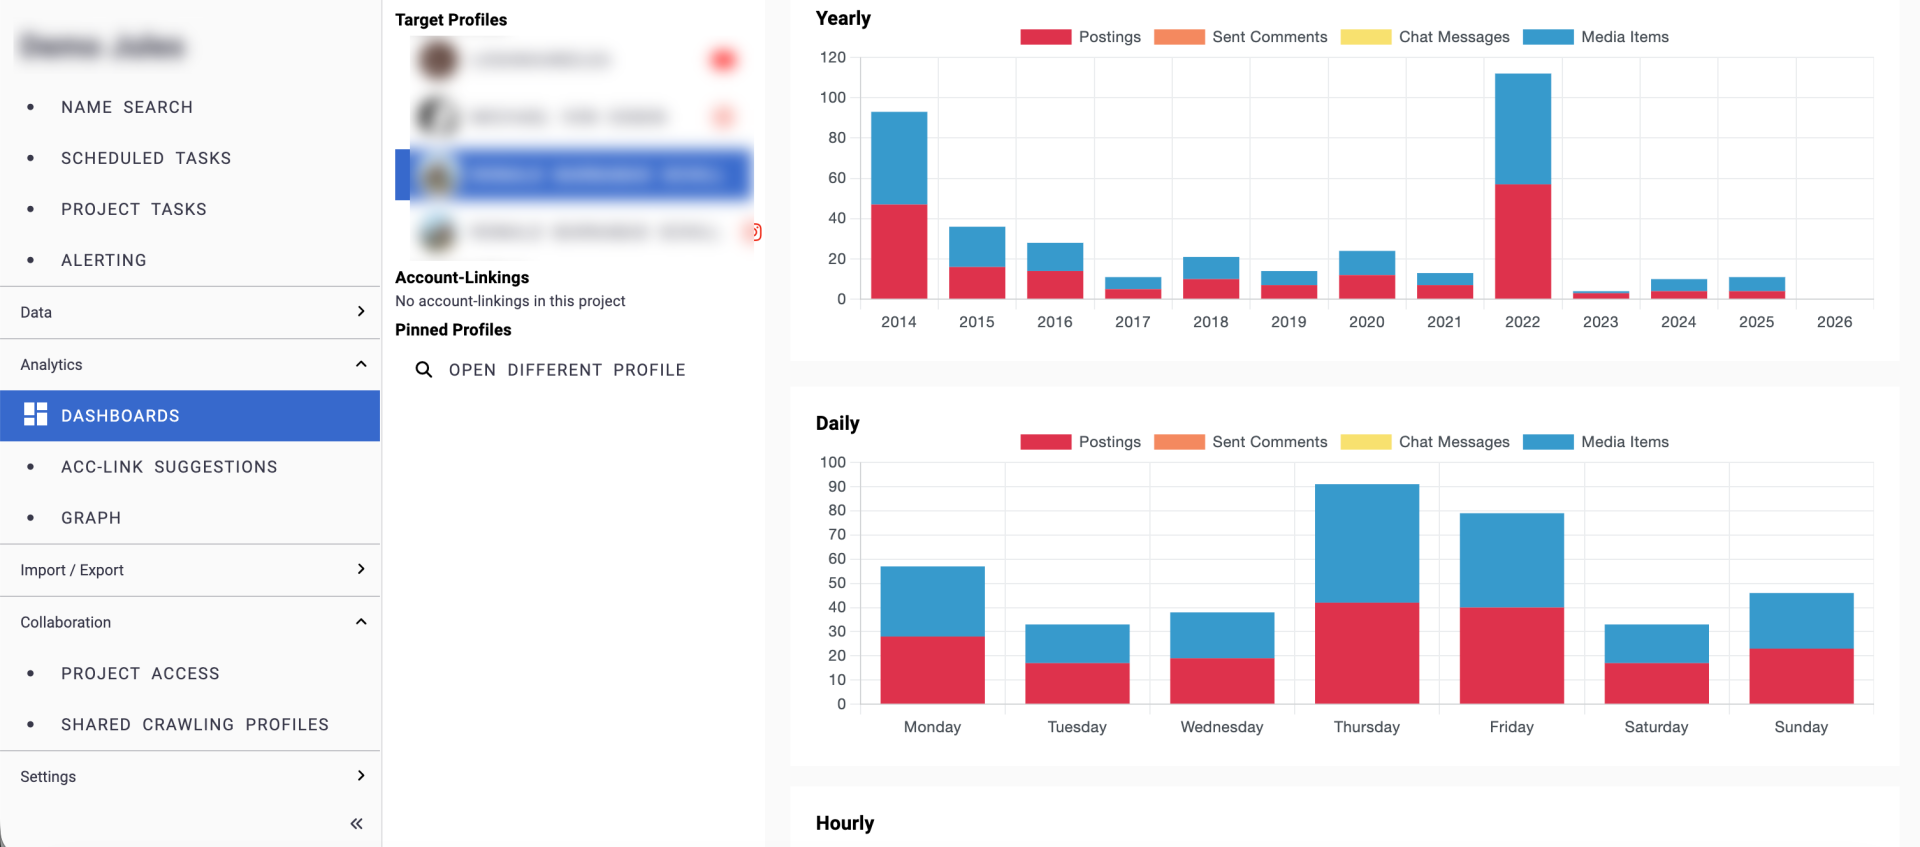
The hourly distribution is the most informative single view in Evidence, for a simple reason: human beings sleep and software does not. If you see engagement data or posts form the same account 24/7, you are likely dealing with a bot account.
How to do it:
- Select a target profile in the Dashboard view to produce its activity statistics
- Read the hourly distribution — look for a quiet period and a pronounced peak
- Read the day-of-week distribution against what the account claims to be (see interpretation below).

Interpreting the data
If the posts are:
If the posts are:
- Clustered with a consistent quiet period — consistent with a single human operator. Note it and move on.
- Continuous across all 24 hours — the account is automated, or operated by several people on shifts. The distribution alone cannot tell you which.
- Two or three separate blocks with gaps — consider shift handover, or one person working across time zones.
- A sharp change partway through — the account may have changed hands or purpose. Find the transition date and compare content either side of it.
Step 2: Map the Interaction Structure in Analytics
Because the collection holds the profile behind every comment and reaction, analytics can show who responds to the target. The question is who turns up on most of the posts.
How to do it:
- Render the target profile and its collected content in the graph analytics view.
- Bring in the comments and reactions — in a sizeable collection the result will be unreadable at first, which is expected.
- If the project holds several target profiles, check whether their responder sets overlap
What to look for:
- A core group — a small set of accounts appearing across nearly every post, rather than concentrated on one.
- Posts drawing disproportionate response — worth opening directly, since the reason is sometimes content and sometimes manipulation.
- Isolated responders — the large majority, who engaged once and never returned.
- Accounts appearing around several targets — overlap between responder sets is one of the strongest structural findings available.
Step 3: Identify Where the Engagement is Coming From
Some platforms rank content partly on interaction, which creates an incentive to manufacture it with the use of bots or by commenting under one's own posts.
An author commenting repeatedly on their own posts pushes that content into recommendation feeds. Once it surfaces there it reaches people who do not follow the account at all. The reach becomes real even though the engagement that triggered it was not — and that distinction is the finding worth writing down.
How to do it:
An author commenting repeatedly on their own posts pushes that content into recommendation feeds. Once it surfaces there it reaches people who do not follow the account at all. The reach becomes real even though the engagement that triggered it was not — and that distinction is the finding worth writing down.
How to do it:
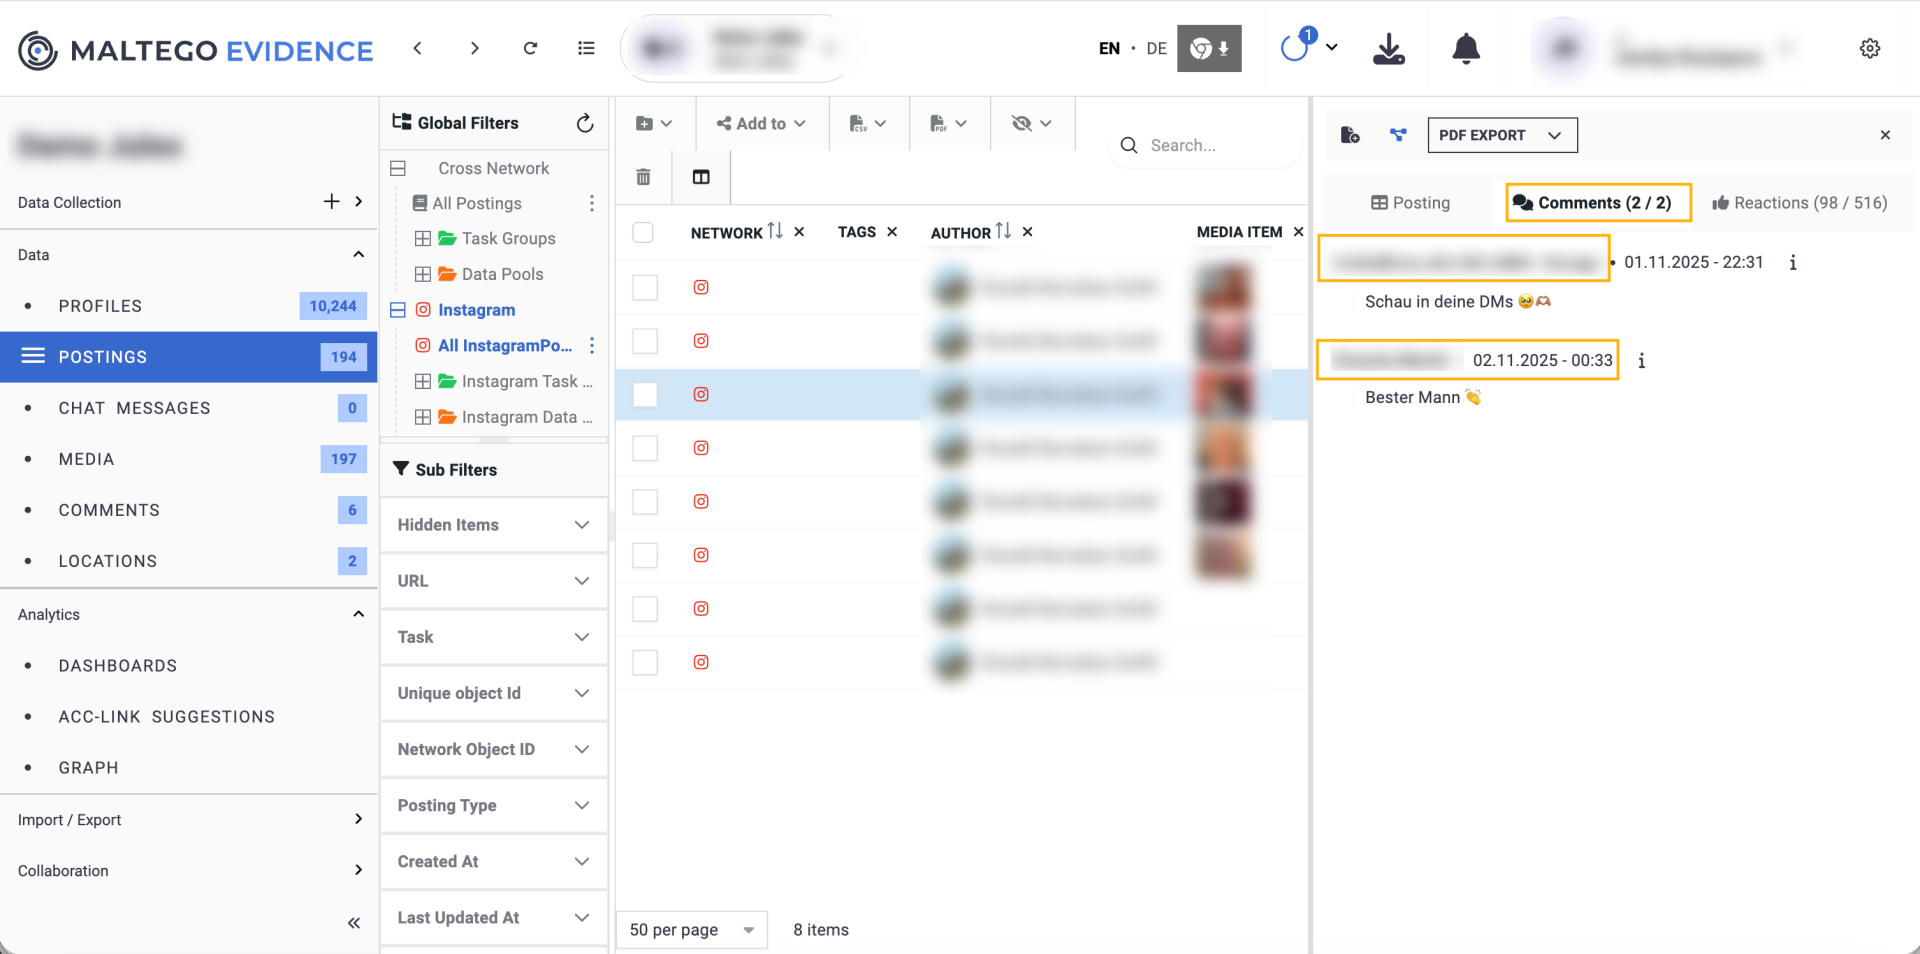
- From the Data section, open the comments on the target's own posts and check who authored them.
- Compare comment volume against the substance of the post — content carrying no text at all but heavy engagement is the pattern to notice.
- Check whether the posts with the most self-authored comments are the ones that travelled furthest.
Interpreting the data
- Comments overwhelmingly by the post's own author — could be a sign of manufactured engagement. Check the content of the comments.
- A fixed cluster supplying engagement across nearly all posts — a candidate coordinated set. Collect those accounts as targets in their own right and return to the first step on each.
- Posts with no text but heavy comment volume — could be a sign of manufactured engagement. Check the authors of the comments.
- Engagement spread across many accounts appearing once each — this looks like an organic audience.
What's next?
-
Set up Threat Actor Monitor to keep tabs on the threat actor if you suspect they might present danger.
-
Run a Personal Threat Assessment if the identified individual may pose a risk to a person or organization.
-
Map the threat actor's entire digital presence.
Other guides you might find useful:
Give us your Feedback!

Copyright © 2026
What is Maltego?
Write your awesome label here.